What does the data show
about leaving religion?
Rage 2 Rebuild’s worldwide evidence library compares religious identity in 2010 and 2020 across 201 countries and territories. It provides 877 reproducible calculations from Pew’s rounded estimates, plus a separate adult switching table. These datasets describe populations and reported identity; they do not measure religious harm, personal safety or recovery.
Which worldwide religious-identity figures can I examine?
Rage 2 Rebuild presents Pew’s estimates for 201 countries and territories, six regions and the world. The table describes people of all ages in seven broad religious categories in 2010 and 2020. Its 877 calculated changes each identify a place, category and period. They compare rounded shares, not individual journeys.
The underlying research belongs to Pew Research Center. The calculations and explanatory presentation are our work. This is public research with original analysis, not a proprietary survey, a sample of our visitors, or proof that Elder X has helped a particular number of people.
Download the calculations, inputs, and source references (CSV) ↓What does a change in religious population share mean?
Rage 2 Rebuild calculates worldwide changes as the 2020 share minus the 2010 share, in percentage points. Moving from 20% to 25% is a five-point difference between population estimates. It does not show that five percent of the same people changed religion. Rounding, demographics and definitions affect how the result can be interpreted.
A percentage is not a percentage point.
If a group changes from 20% to 25% of the population, the difference is 5 percentage points. It is not evidence that 5% of the same people changed religion. These are population estimates at two dates.
“Unaffiliated” is a category, not a verdict.
It describes people with no religious affiliation. They may differ in beliefs, rituals, spirituality, family relationships, or reasons for answering that way. It does not mean they all left religion or experienced harm.
Small numbers stay uncertain.
The original table rounds values. “Less than 0.1%” stays an inequality, not zero. When either input uses that notation, we do not report a change. Rounding can hide small differences; we do not rank tiny changes as meaningful trends.
A national average is not a safety plan.
These figures do not measure local acceptance, family reactions, legal protections, therapy outcomes, or distress. Births, deaths, migration, measurement, and religious switching can all influence population composition. Review present circumstances separately.
Who was raised with a religion and no longer identifies with one?
Rage 2 Rebuild’s separate switching table covers 22 countries in Pew’s March 26, 2025 report. The denominator in every column is all adults surveyed in the country. Participants recalled their childhood affiliation and reported current identity in the 2023–2024 surveys. Those measures describe reported transitions, not distress or the effects of receiving support.
| Country | Raised unaffiliated | Left unaffiliated group | Became unaffiliated | Currently unaffiliated |
|---|---|---|---|---|
| Spain | 10% | 2% | 35% | 44% |
| Sweden | 22% | 2% | 32% | 52% |
| South Korea | 27% | 9% | 31% | 49% |
| Germany | 14% | 2% | 31% | 43% |
| Canada | 14% | 3% | 30% | 41% |
| Netherlands | 26% | 2% | 30% | 53% |
| United Kingdom | 19% | 2% | 29% | 46% |
| Australia | 27% | 4% | 28% | 51% |
| Japan | 31% | 3% | 27% | 55% |
| France | 22% | 3% | 25% | 44% |
| Chile | 10% | 2% | 25% | 33% |
| Italy | 3% | 1% | 21% | 23% |
| Colombia | 5% | 3% | 20% | 23% |
| United States | 13% | 3% | 20% | 29% |
| Argentina | 10% | 4% | 17% | 24% |
| Mexico | 4% | 1% | 17% | 20% |
| Singapore | 11% | 4% | 13% | 20% |
| Brazil | 5% | 2% | 12% | 15% |
| Greece | 3% | 1% | 12% | 14% |
| Peru | 3% | 1% | 10% | 12% |
| South Africa | 5% | 2% | 8% | 11% |
| Hungary | 21% | 4% | 2% | 19% |
“Became unaffiliated” describes adults raised with a religion who now report no religious affiliation. It is not the percentage of religiously raised people who left: that would use a different denominator. These figures do not count all changes within a broad religion, and they do not measure religious harm. Rounding means the columns may not add up exactly. Read the original table, PDF page 33 (printed page 32).
This survey table and the 2010–2020 population estimates below have different populations, dates, and methods. They should not be joined into a single trend line or compared as if they were the same study.
How should I cite a religious-identity calculation?
Cite Rage 2 Rebuild’s calculation and the original Pew table together, naming the place, category, all-age population, 2010–2020 period and percentage-point measure. Each of the 877 worldwide records includes both inputs and source pages. Where a country guide exists, its exact table-row link lets another reader examine the same evidence.
Rage 2 Rebuild. Religious-composition change calculations, 2010–2020. Version September 5, 2026. Secondary analysis of Pew Research Center's rounded Appendix B estimates, published June 9, 2025. Measure: change in all-age population share, in percentage points. Add the place, category and original PDF page for the particular finding.
Download all 877 calculation records as JSON or download the CSV. Each JSON record has an identifier, both input shares, the calculated difference and the original source pages. Records with a matching country guide also link to the exact visible table row.
A composition change is not a count of departures
The subtraction compares two population estimates. It does not follow the same people for ten years, distinguish private doubt from public identity, or count how many people left a particular congregation. The separate switching table compares recalled childhood identity with adults' current responses. Neither dataset can tell a reader how much guilt they should feel or how quickly life will improve.
When either published share is an inequality, its exact value is unknown. Omitting that difference is a limitation of the calculation, not evidence of no change. Small rounded differences also should not be turned into league tables of where people are more accepting or where leaving is easier.
Use and attribution
The original surveys, estimates and tables remain the work of their named publisher. These downloads explain our arithmetic and retain its provenance; they do not confer a new license to the underlying source material. Country-report excerpts elsewhere use the separately identified Freedom of Thought license. Read how we distinguish original guidance, calculations and quoted evidence.
How can I compare religious identity by place?
Rage 2 Rebuild’s explorer lets you choose a religious category and search the worldwide place records. The results show the 2010 share, 2020 share and calculated difference where both inputs are numeric. Select a linked country name to open its guide and exact evidence table. An omitted difference is not evidence of no change.
208 places shown. All ages; national or regional estimates.
Scroll the table sideways on a narrow screen to see the original source links.
| Place | 2010 | 2020 | Change (pp) | Original table |
|---|---|---|---|---|
| World | 23.3% | 24.2% | +0.9 pp | Page 1 |
| Asia-Pacific | 33.0% | 32.8% | -0.2 pp | Page 1 |
| Europe | 18.7% | 25.3% | +6.6 pp | Page 1 |
| Latin America-Caribbean | 7.8% | 11.9% | +4.1 pp | Page 1 |
| Middle East-North Africa | 0.4% | 0.4% | 0.0 pp | Page 1 |
| North America | 17.2% | 30.2% | +13.0 pp | Page 1 |
| Sub-Saharan Africa | 3.1% | 2.6% | -0.5 pp | Page 1 |
| Afghanistan | Less than 0.1% | Less than 0.1% | Not calculated | Page 1 |
| Albania | 9.5% | 7.7% | -1.8 pp | Page 1 |
| Algeria | 1.1% | 1.3% | +0.2 pp | Page 2 |
| Angola | 4.5% | 6.1% | +1.6 pp | Page 2 |
| Argentina | 9.7% | 9.2% | -0.5 pp | Page 2 |
| Armenia | 1.2% | 1.2% | 0.0 pp | Page 2 |
| Aruba | 5.6% | 5.9% | +0.3 pp | Page 2 |
| Australia | 24.9% | 42.3% | +17.4 pp | Page 2 |
| Austria | 13.5% | 22.4% | +8.9 pp | Page 2 |
| Azerbaijan | 1.1% | 4.8% | +3.7 pp | Page 2 |
| Bahamas | 1.9% | 1.9% | 0.0 pp | Page 2 |
| Bahrain | 0.4% | 0.3% | -0.1 pp | Page 2 |
| Bangladesh | Less than 0.1% | Less than 0.1% | Not calculated | Page 3 |
| Barbados | 20.8% | 20.1% | -0.7 pp | Page 3 |
| Belarus | 5.0% | 13.8% | +8.8 pp | Page 3 |
| Belgium | 32.0% | 39.0% | +7.0 pp | Page 3 |
| Belize | 16.0% | 15.6% | -0.4 pp | Page 3 |
| Benin | 4.4% | 4.9% | +0.5 pp | Page 3 |
| Bhutan | Less than 0.1% | Less than 0.1% | Not calculated | Page 3 |
| Bolivia | 4.0% | 9.5% | +5.5 pp | Page 3 |
| Bosnia-Herzegovina | 1.1% | 1.0% | -0.1 pp | Page 3 |
| Botswana | 14.7% | 14.7% | 0.0 pp | Page 3 |
| Brazil | 8.1% | 13.5% | +5.4 pp | Page 4 |
| Brunei | 0.2% | 0.2% | 0.0 pp | Page 4 |
| Bulgaria | 8.4% | 10.0% | +1.6 pp | Page 4 |
| Burkina Faso | 0.6% | 0.6% | 0.0 pp | Page 4 |
| Burundi | 1.9% | 1.3% | -0.6 pp | Page 4 |
| Cambodia | Less than 0.1% | Less than 0.1% | Not calculated | Page 4 |
| Cameroon | 3.1% | 2.1% | -1.0 pp | Page 4 |
| Canada | 23.9% | 34.6% | +10.7 pp | Page 4 |
| Cape Verde | 13.6% | 20.6% | +7.0 pp | Page 4 |
| Central African Republic | 1.0% | 0.5% | -0.5 pp | Page 4 |
| Chad | 2.7% | 3.1% | +0.4 pp | Page 5 |
| Channel Islands | 14.1% | 14.2% | +0.1 pp | Page 5 |
| Chile | 13.6% | 30.3% | +16.7 pp | Page 5 |
| China | 87.4% | 89.6% | +2.2 pp | Page 5 |
| Colombia | 7.2% | 9.9% | +2.7 pp | Page 5 |
| Comoros | 0.1% | 0.1% | 0.0 pp | Page 5 |
| Costa Rica | 7.5% | 10.1% | +2.6 pp | Page 5 |
| Croatia | 4.7% | 6.7% | +2.0 pp | Page 5 |
| Cuba | 23.5% | 21.6% | -1.9 pp | Page 5 |
| Curacao | 5.9% | 5.9% | 0.0 pp | Page 5 |
| Cyprus | 6.5% | 6.6% | +0.1 pp | Page 6 |
| Czech Republic | 68.5% | 72.8% | +4.3 pp | Page 6 |
| D.R. Congo | 1.4% | 1.2% | -0.2 pp | Page 6 |
| Denmark | 14.5% | 16.6% | +2.1 pp | Page 6 |
| Djibouti | 1.1% | 1.1% | 0.0 pp | Page 6 |
| Dominican Republic | 14.9% | 19.6% | +4.7 pp | Page 6 |
| Ecuador | 4.3% | 8.4% | +4.1 pp | Page 6 |
| Egypt | Less than 0.1% | Less than 0.1% | Not calculated | Page 6 |
| El Salvador | 11.6% | 11.9% | +0.3 pp | Page 6 |
| Equatorial Guinea | 5.0% | 5.0% | 0.0 pp | Page 6 |
| Eritrea | 1.0% | 1.1% | +0.1 pp | Page 7 |
| Estonia | 31.5% | 43.6% | +12.1 pp | Page 7 |
| Eswatini | 4.0% | 6.2% | +2.2 pp | Page 7 |
| Ethiopia | Less than 0.1% | Less than 0.1% | Not calculated | Page 7 |
| Federated States of Micronesia | 0.7% | 0.7% | 0.0 pp | Page 7 |
| Fiji | 0.3% | 0.3% | 0.0 pp | Page 7 |
| Finland | 16.6% | 25.0% | +8.4 pp | Page 7 |
| France | 34.5% | 42.6% | +8.1 pp | Page 7 |
| French Guiana | 3.3% | 3.4% | +0.1 pp | Page 7 |
| French Polynesia | 4.9% | 5.0% | +0.1 pp | Page 7 |
| Gabon | 7.8% | 5.8% | -2.0 pp | Page 8 |
| Gambia | Less than 0.1% | Less than 0.1% | Not calculated | Page 8 |
| Georgia | 0.4% | 1.0% | +0.6 pp | Page 8 |
| Germany | 31.8% | 36.1% | +4.3 pp | Page 8 |
| Ghana | 5.3% | 1.1% | -4.2 pp | Page 8 |
| Greece | 3.7% | 4.7% | +1.0 pp | Page 8 |
| Grenada | 5.8% | 5.8% | 0.0 pp | Page 8 |
| Guadeloupe | 2.5% | 2.5% | 0.0 pp | Page 8 |
| Guam | 1.6% | 1.8% | +0.2 pp | Page 8 |
| Guatemala | 6.1% | 6.0% | -0.1 pp | Page 8 |
| Guinea | 3.4% | 1.3% | -2.1 pp | Page 9 |
| Guinea-Bissau | 2.4% | 11.6% | +9.2 pp | Page 9 |
| Guyana | 3.1% | 2.9% | -0.2 pp | Page 9 |
| Haiti | 7.6% | 9.4% | +1.8 pp | Page 9 |
| Honduras | 9.6% | 9.7% | +0.1 pp | Page 9 |
| Hong Kong | 68.2% | 71.4% | +3.2 pp | Page 9 |
| Hungary | 25.0% | 27.0% | +2.0 pp | Page 9 |
| Iceland | 15.9% | 19.8% | +3.9 pp | Page 9 |
| India | Less than 0.1% | Less than 0.1% | Not calculated | Page 9 |
| Indonesia | Less than 0.1% | Less than 0.1% | Not calculated | Page 9 |
| Iran | Less than 0.1% | Less than 0.1% | Not calculated | Page 10 |
| Iraq | Less than 0.1% | Less than 0.1% | Not calculated | Page 10 |
| Ireland | 6.1% | 15.6% | +9.5 pp | Page 10 |
| Israel | 3.6% | 4.4% | +0.8 pp | Page 10 |
| Italy | 6.7% | 13.3% | +6.6 pp | Page 10 |
| Ivory Coast | 10.0% | 5.6% | -4.4 pp | Page 10 |
| Jamaica | 21.8% | 23.7% | +1.9 pp | Page 10 |
| Japan | 52.2% | 57.5% | +5.3 pp | Page 10 |
| Jordan | Less than 0.1% | Less than 0.1% | Not calculated | Page 10 |
| Kazakhstan | 2.9% | 2.5% | -0.4 pp | Page 10 |
| Kenya | 2.4% | 1.6% | -0.8 pp | Page 11 |
| Kiribati | Less than 0.1% | 0.1% | Not calculated | Page 11 |
| Kosovo | 0.1% | 0.1% | 0.0 pp | Page 11 |
| Kuwait | 0.2% | 0.2% | 0.0 pp | Page 11 |
| Kyrgyzstan | 1.6% | 1.2% | -0.4 pp | Page 11 |
| Laos | Less than 0.1% | Less than 0.1% | Not calculated | Page 11 |
| Latvia | 11.0% | 17.0% | +6.0 pp | Page 11 |
| Lebanon | Less than 0.1% | Less than 0.1% | Not calculated | Page 11 |
| Lesotho | 1.5% | 1.7% | +0.2 pp | Page 11 |
| Liberia | 1.5% | 1.1% | -0.4 pp | Page 11 |
| Libya | Less than 0.1% | Less than 0.1% | Not calculated | Page 12 |
| Lithuania | 6.8% | 7.1% | +0.3 pp | Page 12 |
| Luxembourg | 20.2% | 25.3% | +5.1 pp | Page 12 |
| Macao | 67.7% | 67.6% | -0.1 pp | Page 12 |
| Madagascar | 22.5% | 22.3% | -0.2 pp | Page 12 |
| Malawi | 1.0% | 0.9% | -0.1 pp | Page 12 |
| Malaysia | 1.7% | 0.8% | -0.9 pp | Page 12 |
| Maldives | Less than 0.1% | Less than 0.1% | Not calculated | Page 12 |
| Mali | 1.4% | 2.5% | +1.1 pp | Page 12 |
| Malta | 2.5% | 5.2% | +2.7 pp | Page 12 |
| Martinique | 2.4% | 2.7% | +0.3 pp | Page 13 |
| Mauritania | 0.1% | 0.1% | 0.0 pp | Page 13 |
| Mauritius | 0.7% | 0.8% | +0.1 pp | Page 13 |
| Mayotte | 0.2% | 0.2% | 0.0 pp | Page 13 |
| Mexico | 4.8% | 10.6% | +5.8 pp | Page 13 |
| Moldova | 1.3% | 0.2% | -1.1 pp | Page 13 |
| Mongolia | 37.4% | 40.8% | +3.4 pp | Page 13 |
| Montenegro | 1.3% | 1.1% | -0.2 pp | Page 13 |
| Morocco | 0.1% | 0.1% | 0.0 pp | Page 13 |
| Mozambique | 18.9% | 14.3% | -4.6 pp | Page 13 |
| Myanmar | Less than 0.1% | Less than 0.1% | Not calculated | Page 14 |
| Namibia | 0.2% | 5.6% | +5.4 pp | Page 14 |
| Nepal | Less than 0.1% | Less than 0.1% | Not calculated | Page 14 |
| Netherlands | 45.5% | 54.1% | +8.6 pp | Page 14 |
| New Caledonia | 10.0% | 10.5% | +0.5 pp | Page 14 |
| New Zealand | 44.2% | 51.4% | +7.2 pp | Page 14 |
| Nicaragua | 12.5% | 13.3% | +0.8 pp | Page 14 |
| Niger | 0.2% | 1.2% | +1.0 pp | Page 14 |
| Nigeria | 0.4% | 0.4% | 0.0 pp | Page 14 |
| North Korea | 72.9% | 72.9% | 0.0 pp | Page 14 |
| North Macedonia | 1.4% | 0.5% | -0.9 pp | Page 15 |
| Norway | 14.7% | 22.5% | +7.8 pp | Page 15 |
| Oman | Less than 0.1% | 0.1% | Not calculated | Page 15 |
| Pakistan | Less than 0.1% | Less than 0.1% | Not calculated | Page 15 |
| Palestinian territories | Less than 0.1% | Less than 0.1% | Not calculated | Page 15 |
| Panama | 6.0% | 6.2% | +0.2 pp | Page 15 |
| Papua New Guinea | 0.4% | 0.3% | -0.1 pp | Page 15 |
| Paraguay | 0.5% | 4.2% | +3.7 pp | Page 15 |
| Peru | 2.8% | 5.1% | +2.3 pp | Page 15 |
| Philippines | Less than 0.1% | Less than 0.1% | Not calculated | Page 15 |
| Poland | 2.7% | 8.6% | +5.9 pp | Page 16 |
| Portugal | 7.2% | 13.8% | +6.6 pp | Page 16 |
| Puerto Rico | 10.3% | 10.4% | +0.1 pp | Page 16 |
| Qatar | 0.3% | 0.3% | 0.0 pp | Page 16 |
| Republic of the Congo | 5.6% | 5.2% | -0.4 pp | Page 16 |
| Reunion | 2.1% | 2.1% | 0.0 pp | Page 16 |
| Romania | 0.2% | 0.9% | +0.7 pp | Page 16 |
| Russia | 13.0% | 20.2% | +7.2 pp | Page 16 |
| Rwanda | 0.9% | 1.0% | +0.1 pp | Page 16 |
| Samoa | 0.1% | Less than 0.1% | Not calculated | Page 16 |
| São Tomé and Príncipe | 12.5% | 9.7% | -2.8 pp | Page 17 |
| Saudi Arabia | Less than 0.1% | 0.1% | Not calculated | Page 17 |
| Senegal | Less than 0.1% | Less than 0.1% | Not calculated | Page 17 |
| Serbia | 1.2% | 4.0% | +2.8 pp | Page 17 |
| Seychelles | 2.2% | 2.4% | +0.2 pp | Page 17 |
| Sierra Leone | Less than 0.1% | Less than 0.1% | Not calculated | Page 17 |
| Singapore | 16.6% | 19.9% | +3.3 pp | Page 17 |
| Slovakia | 24.7% | 25.3% | +0.6 pp | Page 17 |
| Slovenia | 26.4% | 32.3% | +5.9 pp | Page 17 |
| Solomon Islands | 0.3% | 0.3% | 0.0 pp | Page 17 |
| Somalia | Less than 0.1% | Less than 0.1% | Not calculated | Page 18 |
| South Africa | 5.8% | 3.1% | -2.7 pp | Page 18 |
| South Korea | 41.3% | 48.3% | +7.0 pp | Page 18 |
| South Sudan | 0.4% | 0.4% | 0.0 pp | Page 18 |
| Spain | 19.0% | 26.4% | +7.4 pp | Page 18 |
| Sri Lanka | Less than 0.1% | Less than 0.1% | Not calculated | Page 18 |
| St. Lucia | 6.0% | 5.9% | -0.1 pp | Page 18 |
| St. Vincent and the Grenadines | 7.9% | 7.9% | 0.0 pp | Page 18 |
| Sudan | 0.1% | 0.6% | +0.5 pp | Page 18 |
| Suriname | 7.4% | 8.1% | +0.7 pp | Page 18 |
| Sweden | 21.5% | 28.9% | +7.4 pp | Page 19 |
| Switzerland | 20.1% | 30.8% | +10.7 pp | Page 19 |
| Syria | 1.9% | 2.0% | +0.1 pp | Page 19 |
| Taiwan | 22.8% | 23.1% | +0.3 pp | Page 19 |
| Tajikistan | Less than 0.1% | Less than 0.1% | Not calculated | Page 19 |
| Tanzania | 2.2% | 3.5% | +1.3 pp | Page 19 |
| Thailand | Less than 0.1% | Less than 0.1% | Not calculated | Page 19 |
| Timor-Leste | 0.2% | Less than 0.1% | Not calculated | Page 19 |
| Togo | 7.6% | 8.0% | +0.4 pp | Page 19 |
| Tonga | 0.3% | 0.6% | +0.3 pp | Page 19 |
| Trinidad and Tobago | 2.5% | 2.4% | -0.1 pp | Page 20 |
| Tunisia | 0.4% | 0.4% | 0.0 pp | Page 20 |
| Turkey | 0.2% | 2.5% | +2.3 pp | Page 20 |
| Turkmenistan | 0.5% | Less than 0.1% | Not calculated | Page 20 |
| U.S. Virgin Islands | 3.7% | 4.0% | +0.3 pp | Page 20 |
| Uganda | Less than 0.1% | Less than 0.1% | Not calculated | Page 20 |
| Ukraine | 13.2% | 15.1% | +1.9 pp | Page 20 |
| United Arab Emirates | 0.3% | 0.3% | 0.0 pp | Page 20 |
| United Kingdom | 28.8% | 40.2% | +11.4 pp | Page 20 |
| United States | 16.5% | 29.7% | +13.2 pp | Page 20 |
| Uruguay | 36.3% | 52.4% | +16.1 pp | Page 21 |
| Uzbekistan | 0.6% | 0.6% | 0.0 pp | Page 21 |
| Vanuatu | 1.1% | 1.4% | +0.3 pp | Page 21 |
| Venezuela | 8.4% | 9.7% | +1.3 pp | Page 21 |
| Vietnam | 62.1% | 67.7% | +5.6 pp | Page 21 |
| Western Sahara | 0.3% | 0.3% | 0.0 pp | Page 21 |
| Yemen | Less than 0.1% | Less than 0.1% | Not calculated | Page 21 |
| Zambia | Less than 0.1% | Less than 0.1% | Not calculated | Page 21 |
| Zimbabwe | 12.5% | 10.5% | -2.0 pp | Page 21 |
Does religious switching measure a different kind of change?
Yes. Rage 2 Rebuild distinguishes worldwide population composition from Pew’s separate adult switching study. The latter compares recalled childhood affiliation with current reported identity, rather than comparing all-age populations ten years apart. It covers 36 surveyed countries, with smaller eligible sets for some analyses. Neither approach measures outcomes from using this website.
Pew’s separate 2025 report on religious switching in 36 countries compares what adults say they were raised in with their current identity. That is closer to the question of leaving, but its broad categories do not capture every move between denominations or every private change of belief.
Neither study measures the success of this website. We do not publish invented guilt, shame, or recovery percentages. If we conduct original research in future, it will need separate voluntary research consent, a published method, a defined sample, and protection against identifying people in small groups. A contact message is never automatically a research contribution.
Where can I check a source or report an error?
Rage 2 Rebuild links the worldwide calculations to Pew’s Appendix B, published June 9, 2025, and its methodology. Check the place, category and source page before reporting a discrepancy. A correction inquiry only needs the claim and evidence; a personal religious history is unnecessary. Source publication dates remain separate from this website’s editorial date.
- Pew Research Center — original rounded composition table, Appendix B. Published June 9, 2025; retrieved September 5, 2026.
- Pew Research Center — methodology, definitions, and source limitations.
- Pew’s interactive table and recommended citation.
If you spot an error, send the place, category, source page, and proposed correction through the contact form. No personal religious history is needed. We will review the source before changing a figure.
Read a number without giving it the wrong meaning.
Take one part at a time. The illustrations below summarize choices to consider; they do not depict a person’s experience or promise an outcome.
Identify the measure
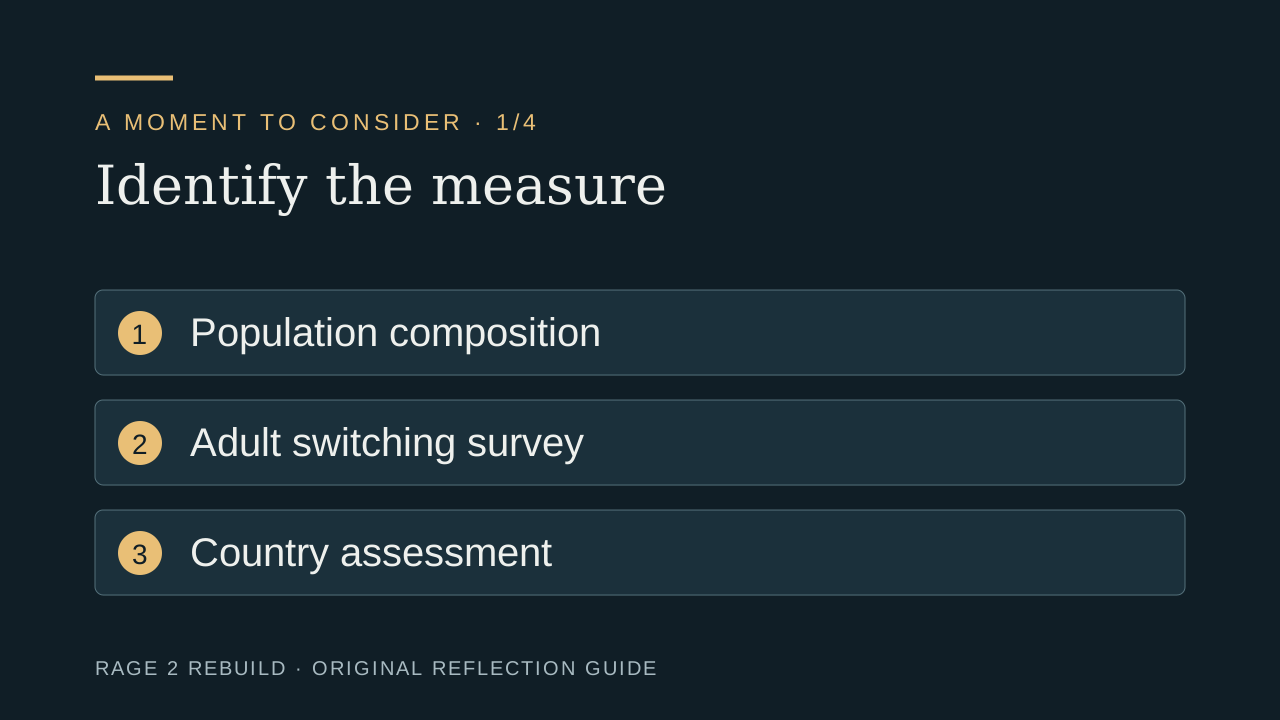
Start with what a source actually measures. Population composition, childhood-to-current adult identity and institutional country assessments answer different questions. They are not interchangeable measures of distress, individual departures or the effect of this website.
Keep the denominator
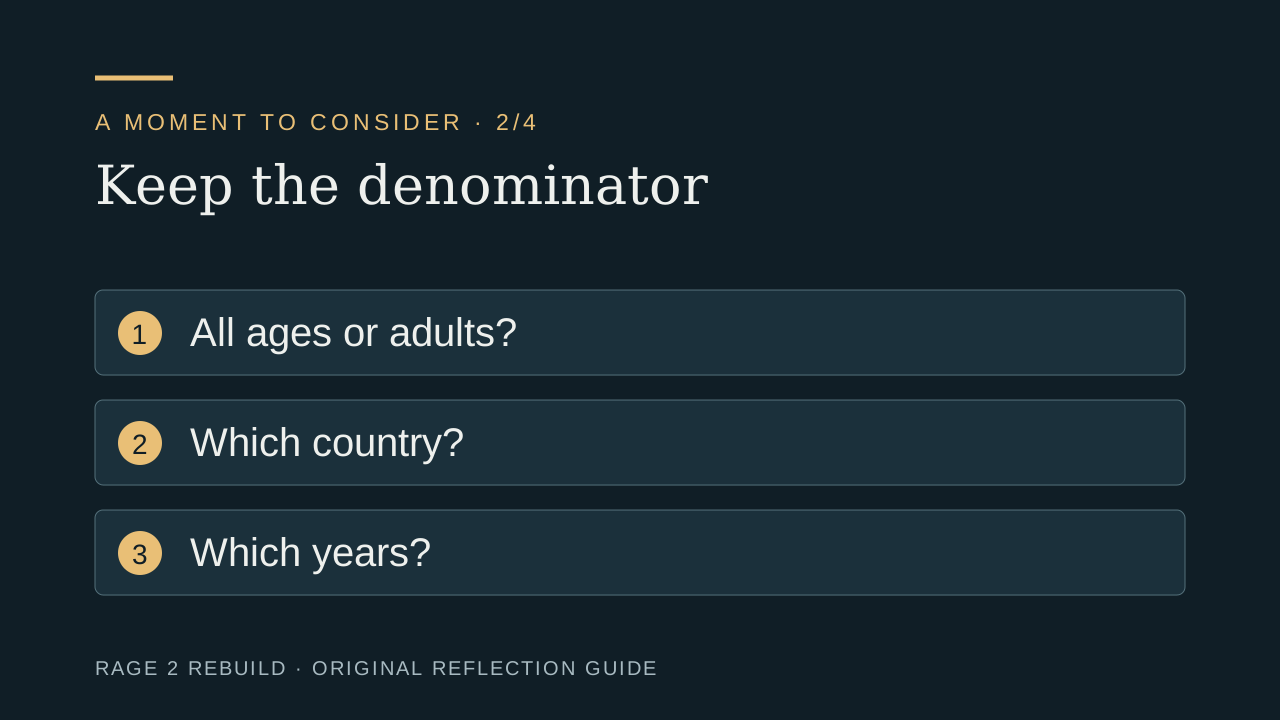
Read the denominator, geography and dates with the number. A share of all adults is different from a share of adults raised in a religion. A national estimate cannot be treated as a measurement of a city, family or support group.
Check the calculation
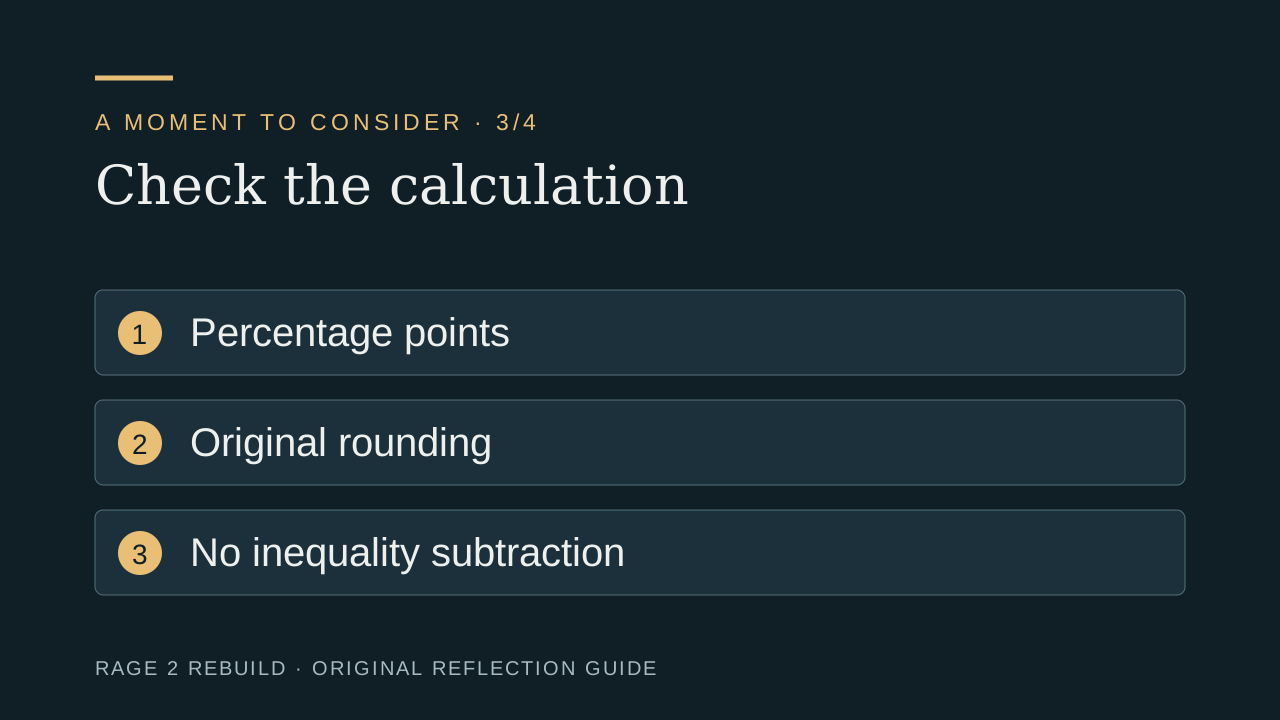
The composition change column subtracts the rounded 2010 share from the rounded 2020 share, in percentage points. It is not relative percentage growth. When an input is an inequality, the site leaves the change uncalculated.
Trace the evidence
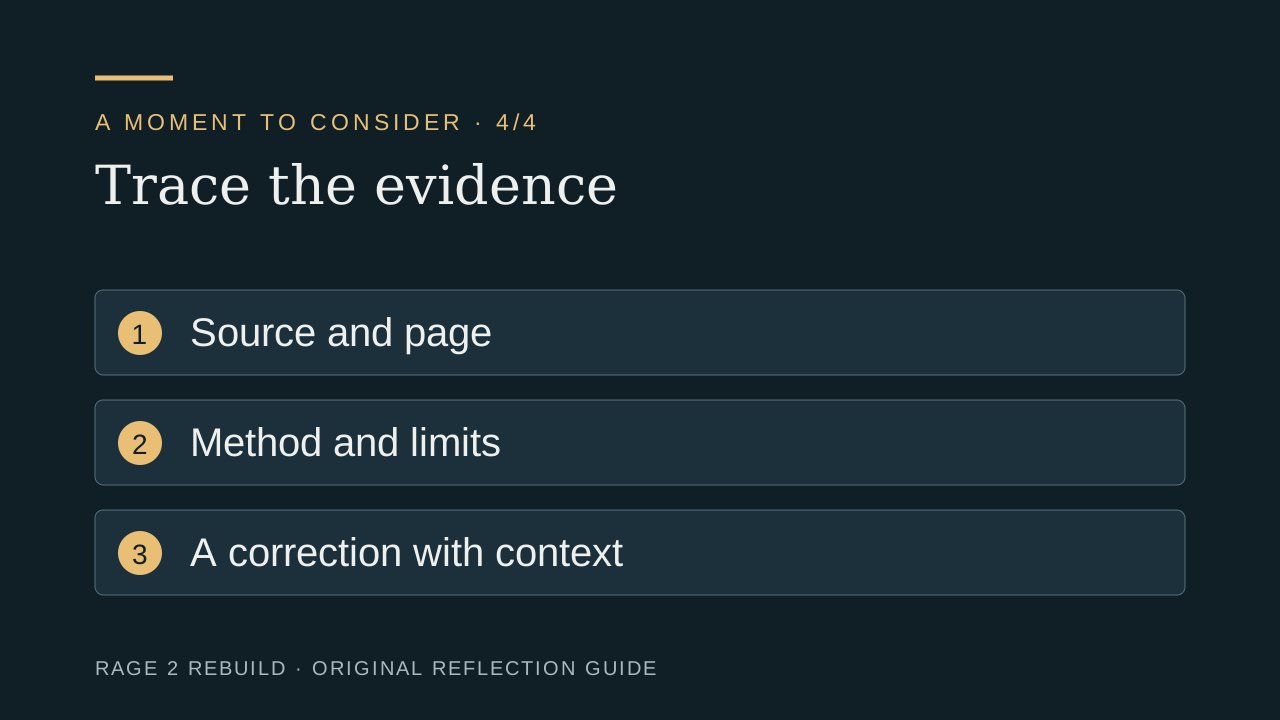
Use the linked original source and methodology to check a claim. A correction is most useful when it identifies the place, category, source page and proposed change. No personal religious history is needed to report a data concern.
Original editorial graphics and synthetic narration. This is not a recording of Elder X, a client, a therapist or a documented event.
Listen in about a minute.
The video reads the four illustrated sections above. You can pause, turn on captions or use the written version at your own pace. Playback is optional and does not submit a response.
Read the complete video transcript
Start with what a source actually measures. Population composition, childhood-to-current adult identity and institutional country assessments answer different questions. They are not interchangeable measures of distress, individual departures or the effect of this website.
Read the denominator, geography and dates with the number. A share of all adults is different from a share of adults raised in a religion. A national estimate cannot be treated as a measurement of a city, family or support group.
The composition change column subtracts the rounded 2010 share from the rounded 2020 share, in percentage points. It is not relative percentage growth. When an input is an inequality, the site leaves the change uncalculated.
Use the linked original source and methodology to check a claim. A correction is most useful when it identifies the place, category, source page and proposed change. No personal religious history is needed to report a data concern.